
Manage, understand and reduce the cost and carbon of every building you run.
One shared foundation of building and meter data, plus a suite of specialist tools — cost analysis, decarbonisation planning, solar and battery modelling, carbon reporting, consent and network lookups — all from one place.
Run the full suite day to day across a portfolio of sites.
Model options, build the investment case, share the result with a client.
A simplified read-only portal showing only the results that matter to them.
Portfolios & sites
Everything starts with a record of your buildings. Add a site by searching an address and the system automatically looks up over 20 address-matched UK data sources to build its profile — then you decide how it gets permission to see the usage data.
Search an address on a map, or upload a file of thousands and work through a review queue.
Bring your own data, or get it from industry sources with the appropriate permissions — at all granularities, through Perse data connectors.
Choose which Optimise tools run against each site and meter.
Address matching is what ties them together — every dataset below is joined to the same building record, with no manual reconciliation.
Why the foundation holds up at scale
From 10 to 100,000+ addresses in one go. Upload a file, get the best matched result, verify, and add the sites to your portfolio.
Matches business addresses against every relevant industry dataset — meter data, building fabric from insurance, EPC, business rates building information, substation records and more.
Bring data through the industry connectors, or upload it in bulk against your portfolios — whichever route your estate allows.
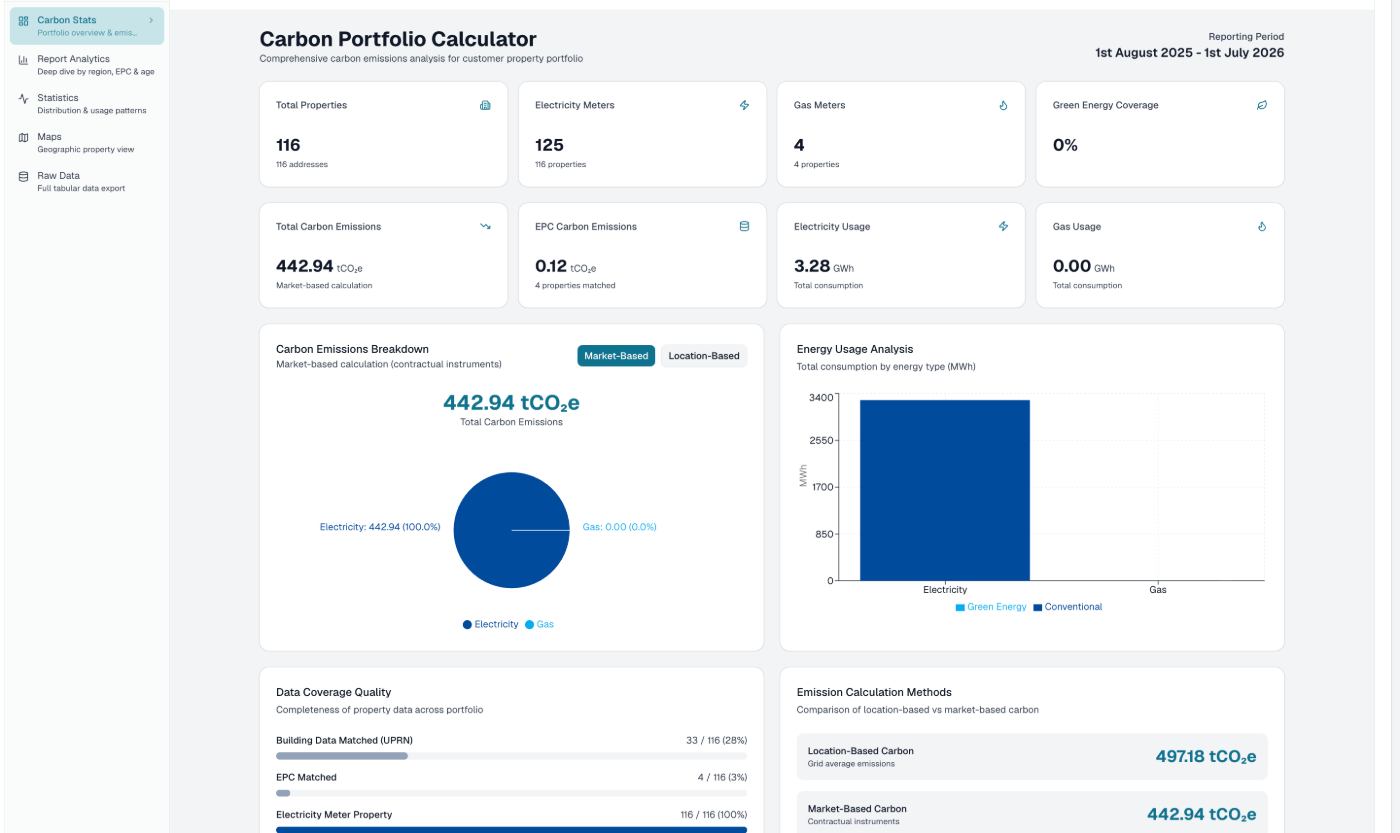
Energy & Carbon Reporting
The reporting engine customers use to meet their regulatory obligations and to build a credible net zero plan. Turns a portfolio's real energy data into emissions and consumption reports fit for disclosure — one-off or recurring, downloaded or delivered automatically.
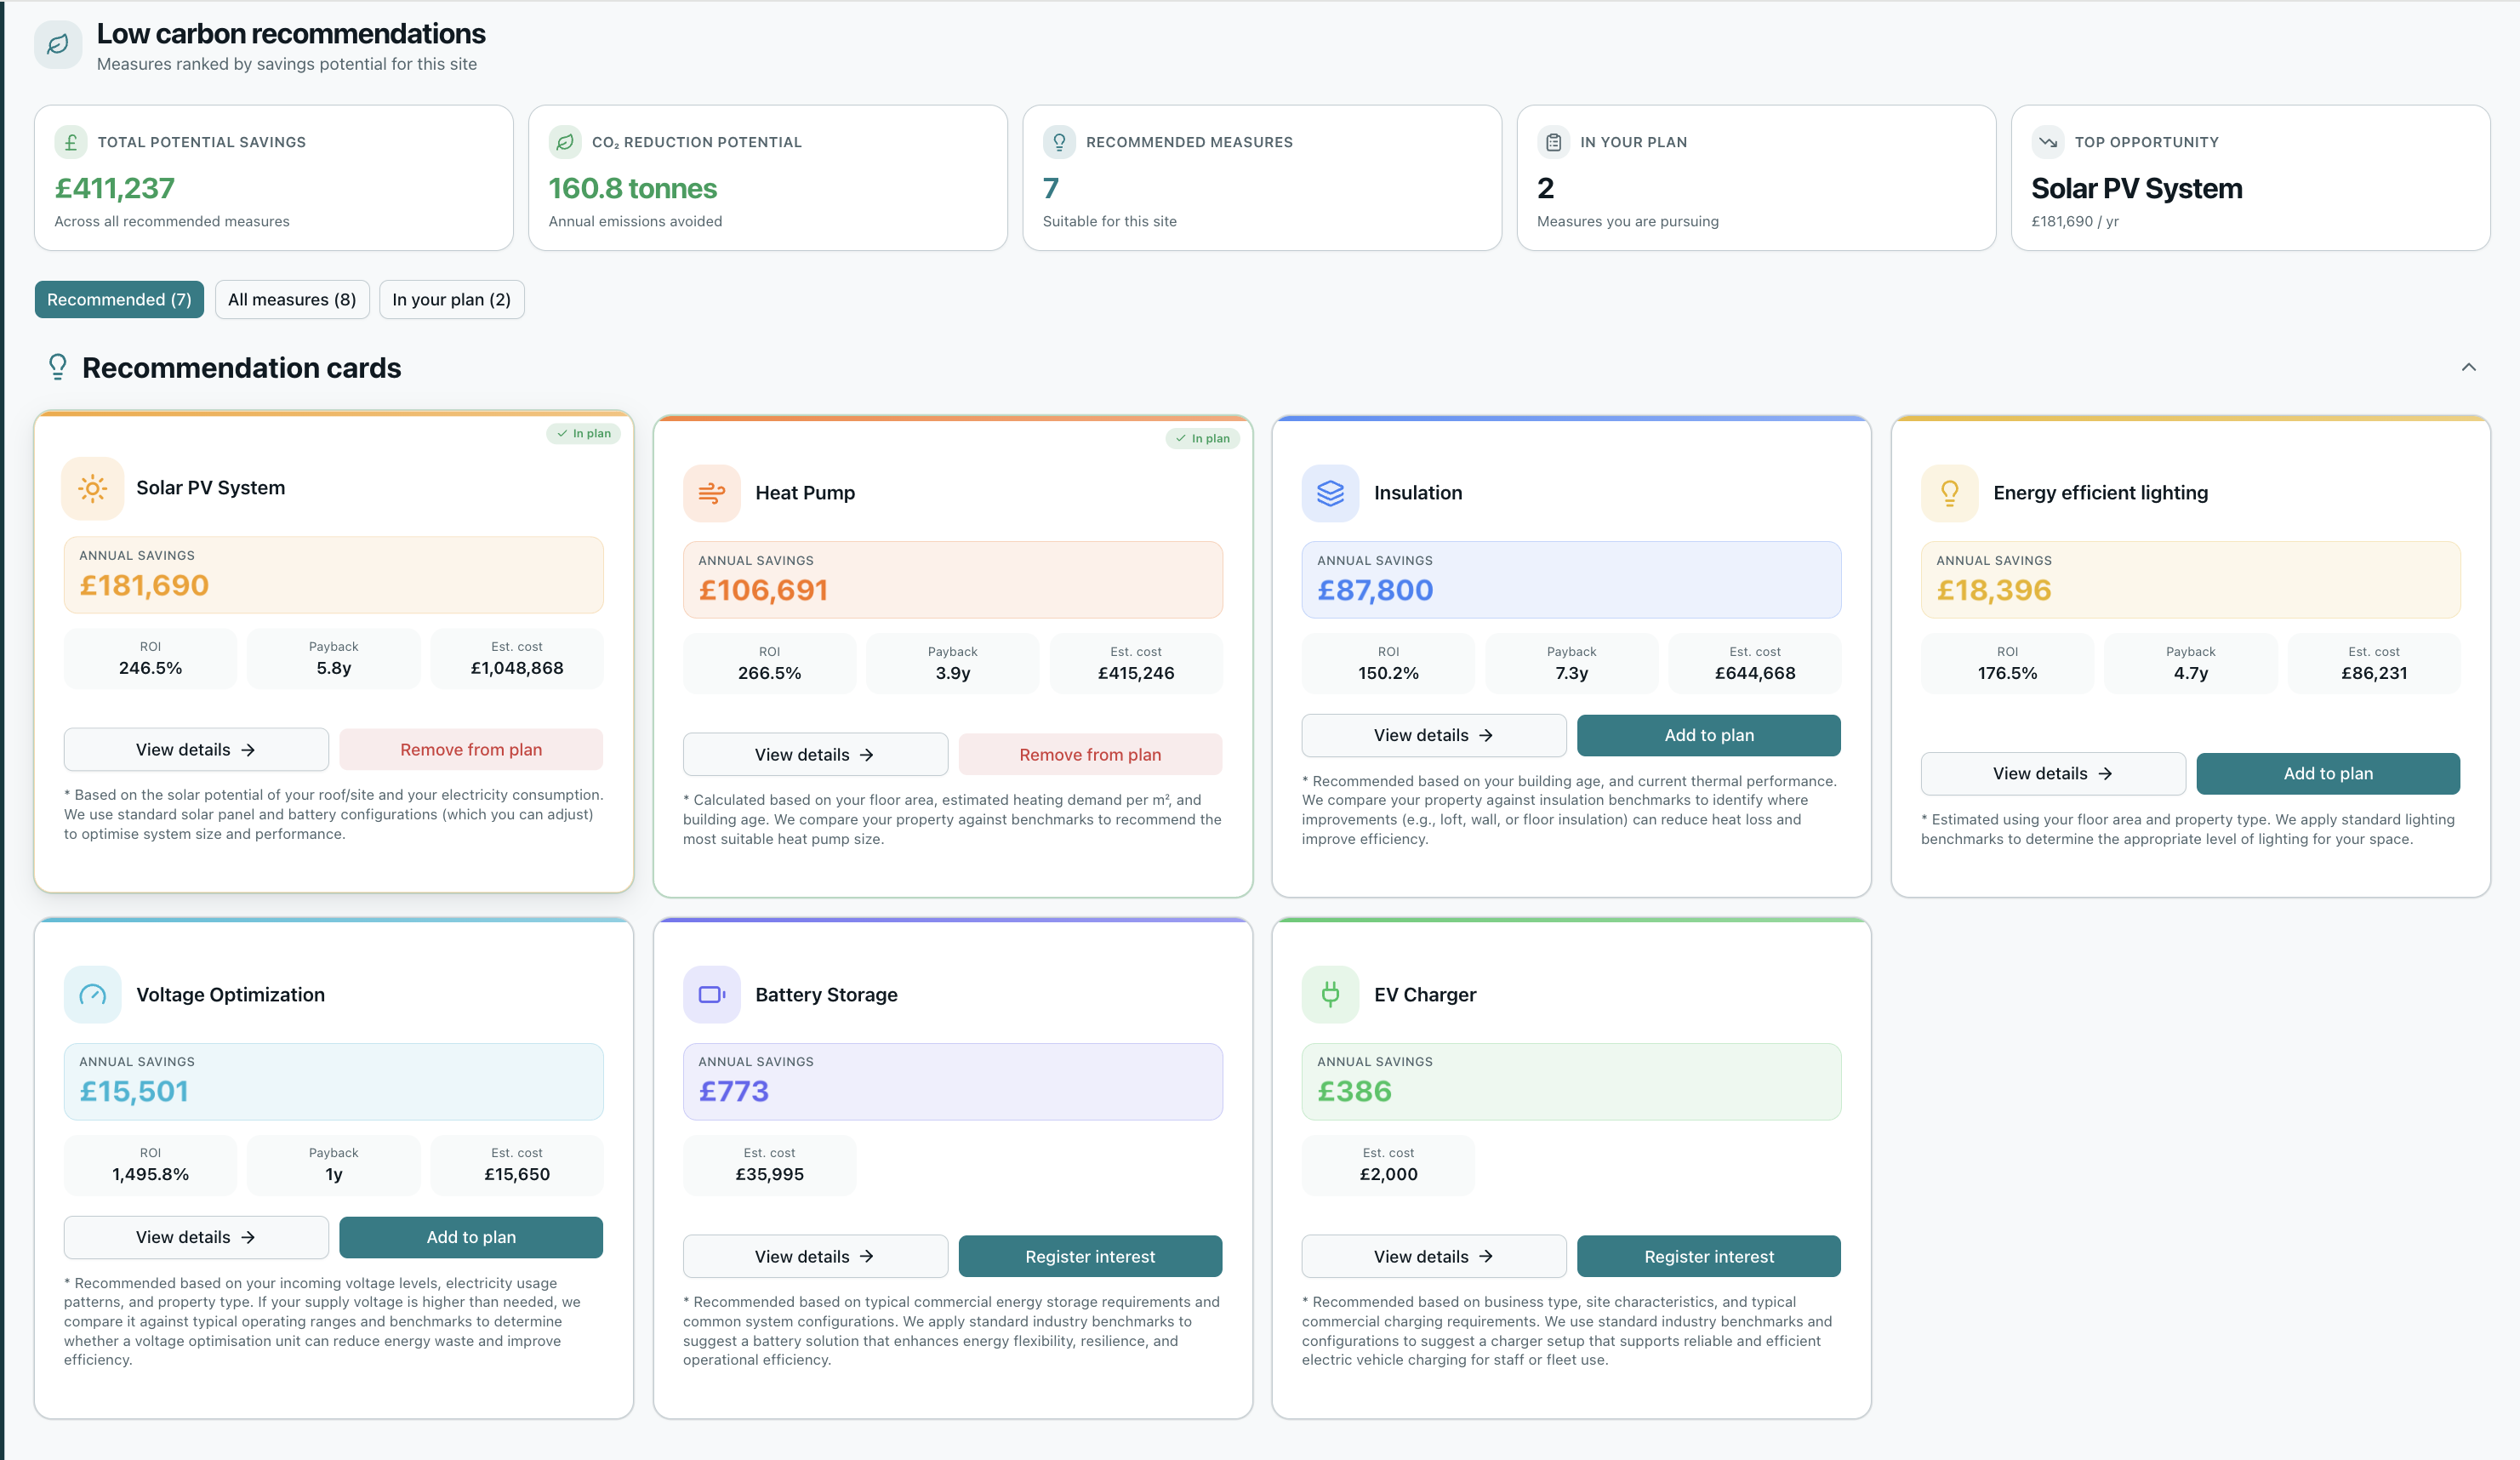
Low Carbon Options
Assesses what a site could do to cut its carbon footprint, and puts a financial case behind every option — projected savings, upfront cost, return on investment and payback time.
Modelled from building age, floor area and half-hourly usage — no site visit.
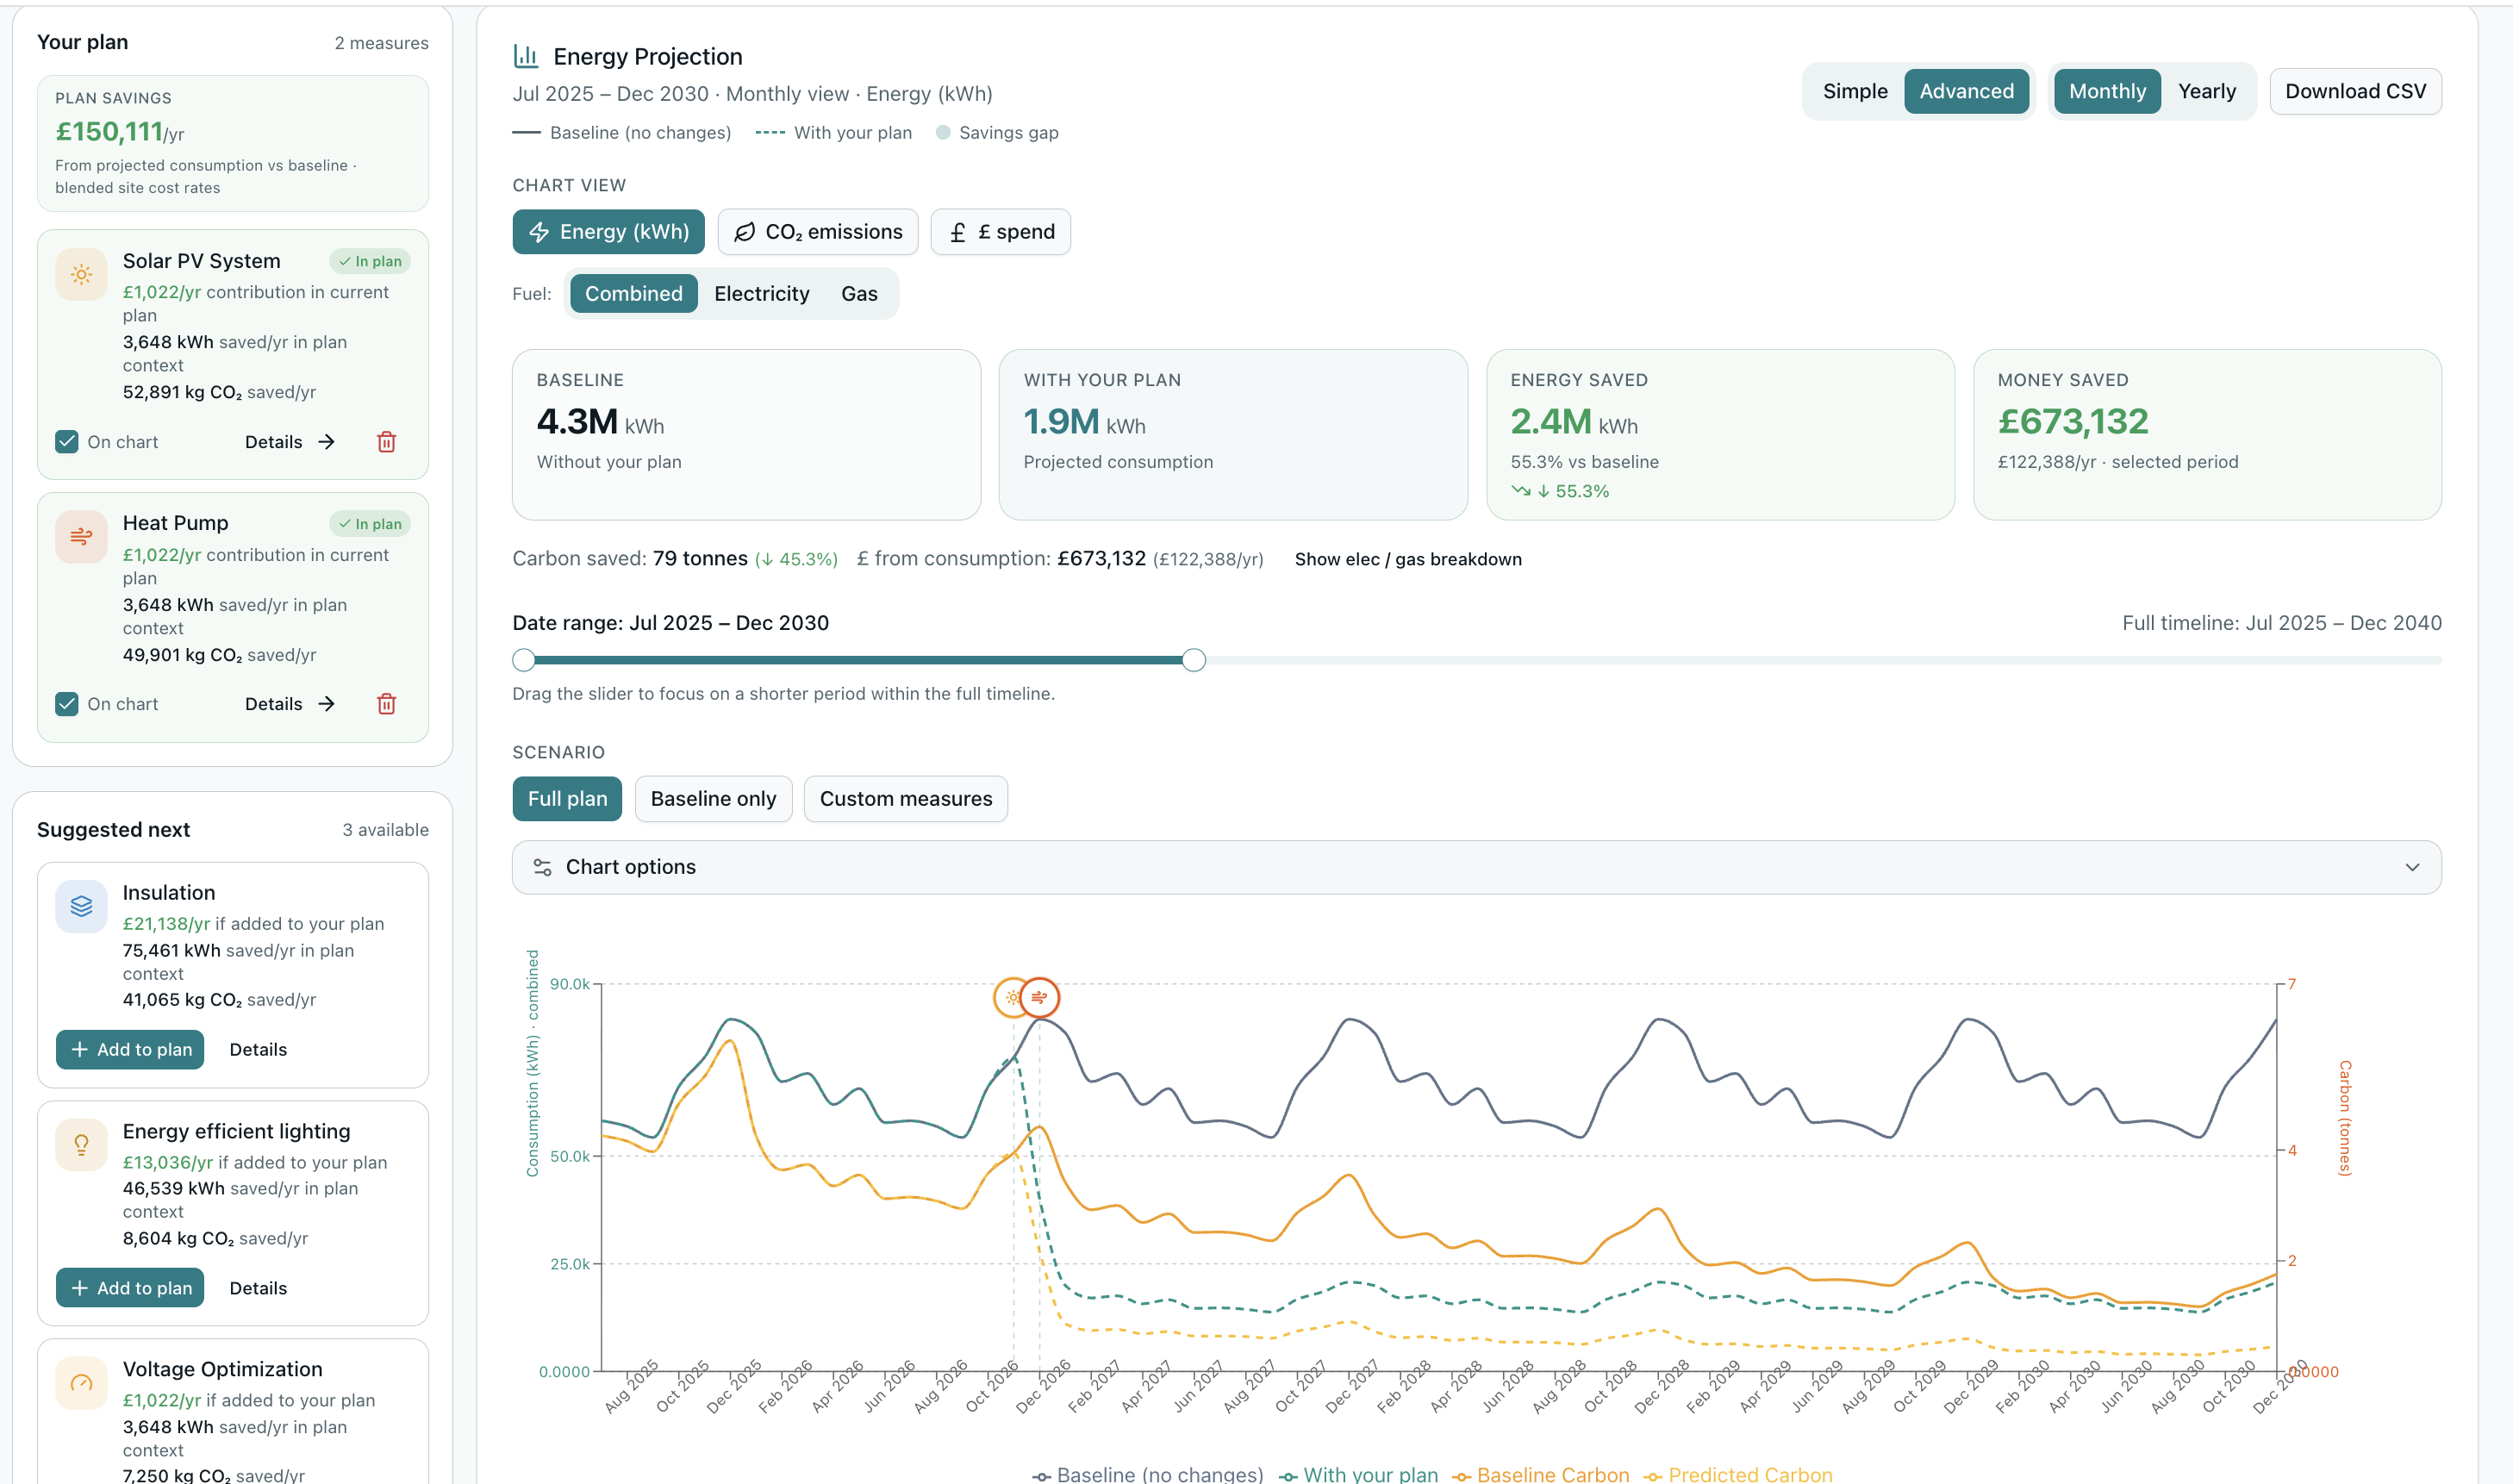
Solar & Battery Optimisation
Model solar and battery investments against a site's real usage, then rank the sized options by how quickly they pay for themselves.
Solar panel dropper
A full satellite-based system designer built into every quote. Draw the actual roof, drop real panel SKUs, exclude chimneys and vents, and spin it round in 3D — before you've left the driveway.
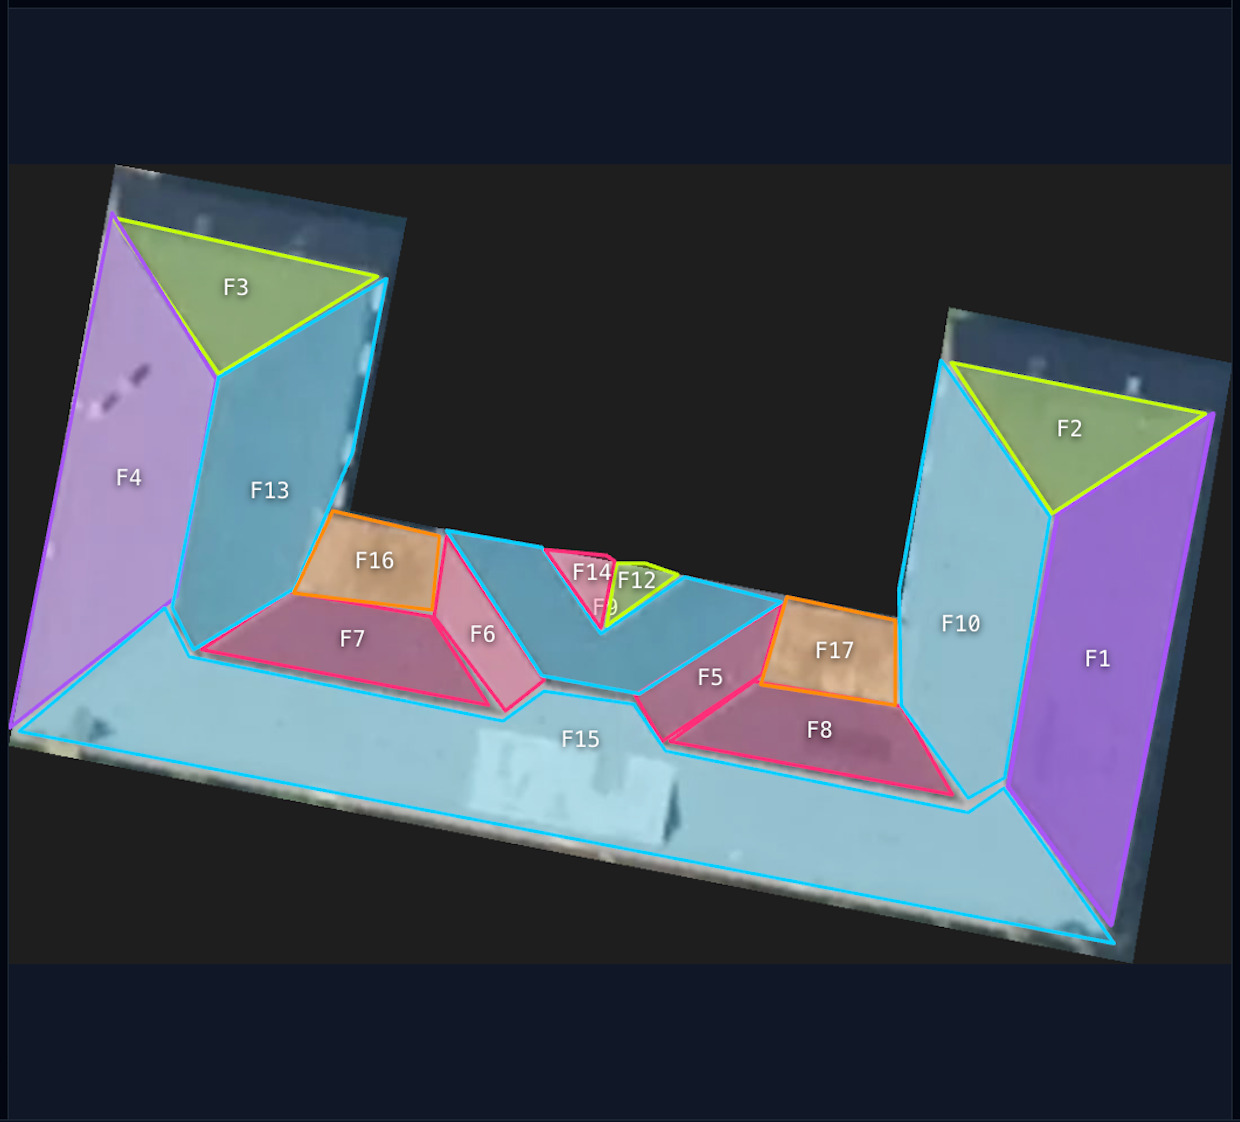
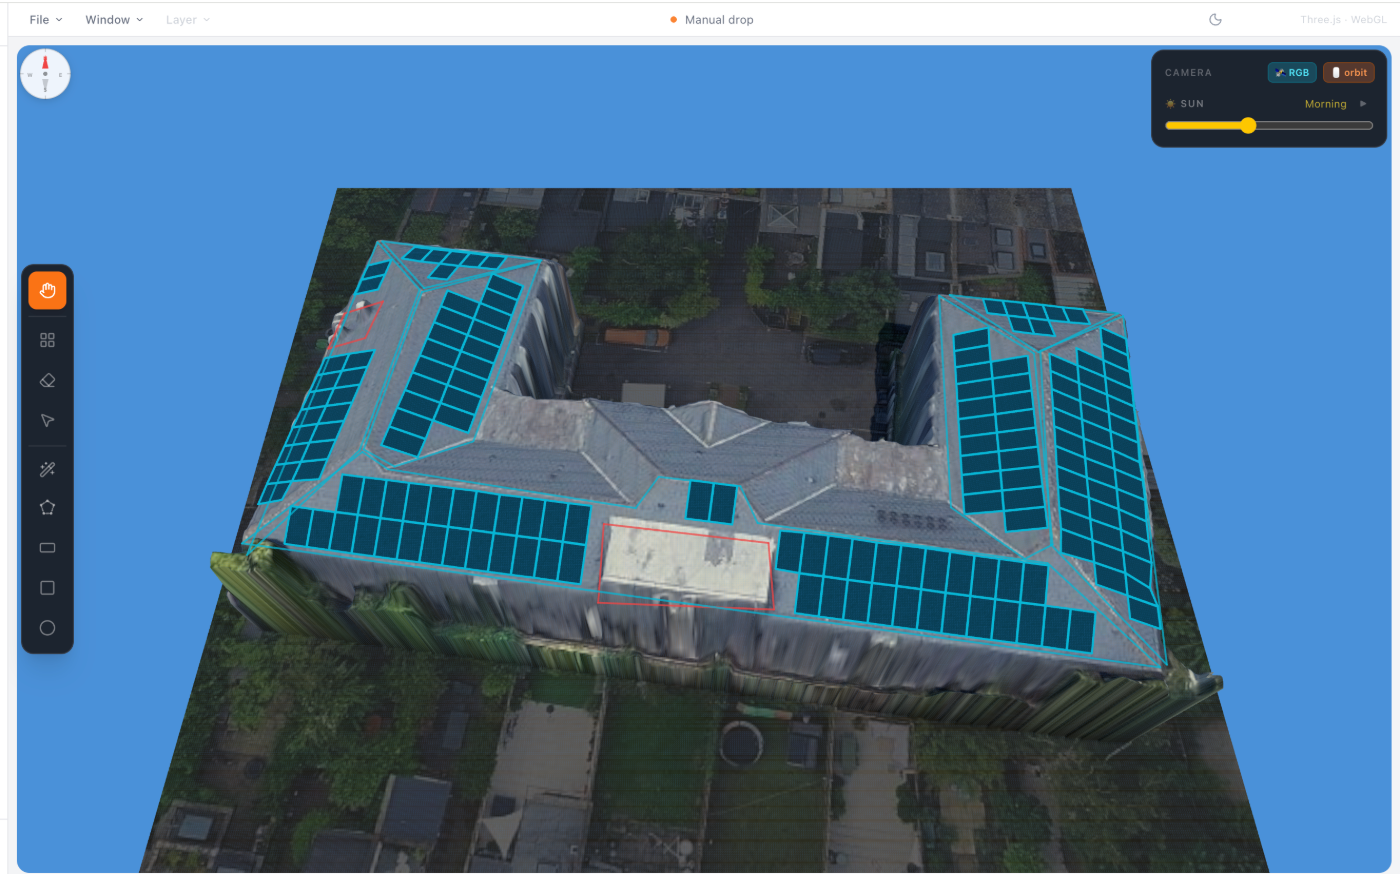
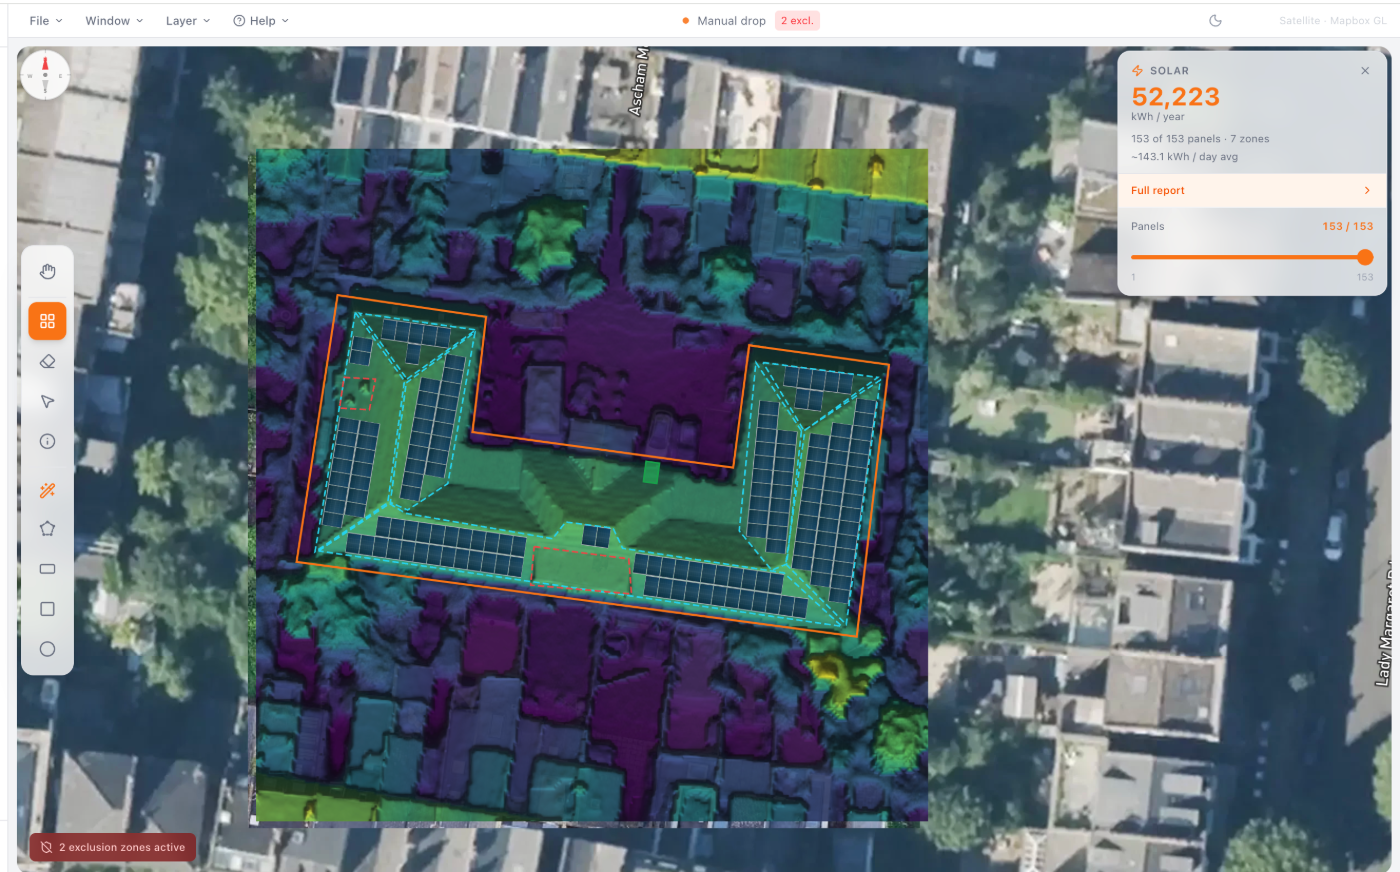
Every roof plane is found and classified straight from the aerial image — flat, triangular, trapezoid and irregular faces outlined automatically before you place a single panel.
Flat, hipped, gabled, mansard, butterfly, compound and more — matched to the real building, not a generic box.
Defra, Google and BlueSky LiDAR data compute each roof's actual pitch and orientation, pixel by pixel — not a flat assumption.
Mark chimneys, vents and skylights so panels are placed around them automatically.
Fill a roof zone instantly with smart alignment and spacing, then fine-tune panel by panel.
Orbit a true-to-life reconstruction, switch between aerial imagery and a LiDAR elevation view, with dynamic shadows as the sun moves.
Annual and monthly yield sourced from PVGIS, the EU's independent irradiance dataset — plus access to Google Solar. Not an in-house guess.
Sized, wattage-rated and priced by manufacturer — not a placeholder figure. Bring your own panel, or use the marketplace.
Every analysis runs at portfolio scale
The tools above aren't single-site calculators. Upload 10 addresses or 100,000, and the same models run across all of them in one go — then rank the results by whatever matters: payback, saving, carbon or capital cost.
Set a selection rule once — best payback, lowest cost, largest carbon cut — and every site gets its winning scenario picked automatically.
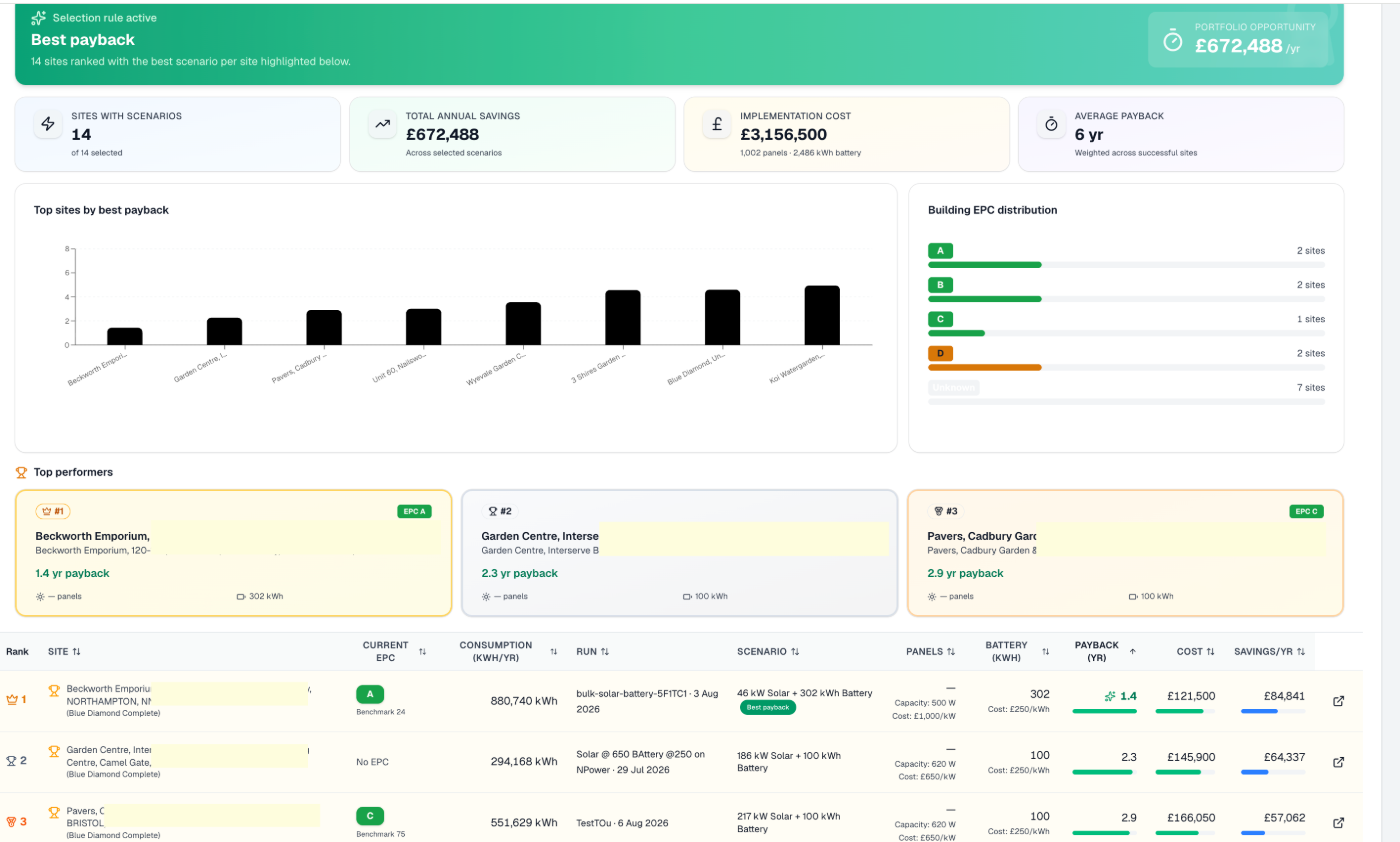
Ranked measures with cost, saving and payback for every site in the upload — not one at a time.
Size and price solar and storage across the whole estate, then compare planning options portfolio-wide.
Break every meter's bill into its 59 charge categories and total the exposure across the portfolio.
One emissions baseline covering every site, with coverage gaps flagged before the report goes out.
Every tool your business needs
Cost analysis, research, permissions, network data and the vendors who deliver the work — the supporting tools that make the headline analysis trustworthy and actionable.
Non-commodity costs
Breaks down the network, environmental and regulatory charges that sit on top of the energy itself.
Network & substation lookup
Public information about the UK electricity network at any address, from regional grid down to local low-voltage supply.
Time-of-use tariff admin
Configure the tariffs that power calculations everywhere else in the platform.
Consent management
The permissions that let Optimise access usage data — active, pending and withdrawn, with the evidence behind each.
Vendor & marketplace services
The delivery side of a plan: who installs it, who funds it, and where every quote has got to.
Company analytics
Research any UK company for prospecting and account work.
The Customer Portal
A simplified, read-only view for the business or property owner whose sites you analyse. They only ever see the sites shared with them, and only the products they've been granted.
A simplified mirror of the options dashboard: key metrics, top measures, savings and trends.
The specific result you chose to share, with only the sections you decided to expose.
Shared reports as the same interactive dashboards used internally.
43 sites in. A £6.8m solar and battery investment decision out.
A UK retail estate ran its whole half-hourly portfolio through Optimise. No surveys — the plan came back phased, priced and financed.
- 01Every site loaded, consent given.
- 02Optimise pulled the energy and building data for each one.
- 03Solar and battery sized against their current tariffs.
- 04Our supplier relationships got real time-of-use tariffs for all 43.
- 05Re-ran on those tariffs — out came a ranked build order.
- 06Vendor financing priced in, modelled over 30 years.
See Optimise on your own portfolio
Bring one address. We'll pull the EPC, find the meters and show you the recommendations it produces.